Pandas
In this example, we'll show you how to use DuckDB and Pandas to extract and manipulate Overture data in a Jupyter notebook. We're using a Pandas DataFrame as an ideal structure for handling a small to medium amount of data and GeoPandas to extend Pandas for operations on geometric types. DuckDB allows us to fetch only the data we need from Overture's GeoParquet files stored on Microsoft Azure or AWS S3.
Installation requirements
To follow along with these examples, you should have JupyterLab or Jupyter Notebook running and the following dependencies installed:
- Pandas
- GeoPandas
- DuckDB, DuckDB spatial extension, and DuckDB AWS extension or DuckDB azure extension.
- JupySQL (optional)
- duckdb-engine (optional)
A executable version of this notebook is available on Notebook Sharing Space. More examples are available in the notebooks directory in our docs repository on GitHub.
Example
Let's start by importing our toolkit.
# import our toolkit
import pandas as pd
import geopandas as gpd
import duckdb
from shapely import wkt
# no need to import duckdb_engine, JupySQL will auto-detect driver
# load (or reload) jupysql Jupyter extension to create SQL cells
%reload_ext sql
The DuckDB documentation offers tips and examples for running DuckDB queries in Jupyter notebooks. In this example, we're using duckdb-engine and JupySQL. You can also connect to DuckDB natively.
# DuckDB in-memory database
%sql duckdb://
Next, we'll install and load DuckDB extensions to work with spatial data and connect to AWS. (Or you can use the Azure extension to connect to the Overture data stores on Azure.)
%sql INSTALL spatial;
%sql INSTALL httpfs;
%sql LOAD spatial;
%sql LOAD httpfs;
%sql SET s3_region='us-west-2'
We can set the configurations on JupySQL to directly output data to Pandas and to simplify the output that is printed to the notebook.
%config SqlMagic.autopandas = True
%config SqlMagic.feedback = False
%config SqlMagic.displaycon = False
Now we're going to extract data from Overture's base theme for an area along the Gulf Coast. The magic %%sql command turns the notebook cell into a SQL cell and allows us to dump our query results in a Pandas DataFrame. Note: this query takes about a minute run.
%%sql gulf_water <<
SELECT
    id,
    names.primary AS primary_name,
    ST_AsText(geometry) as geometry
FROM
    read_parquet('s3://overturemaps-us-west-2/release/2024-09-18.0/theme=base/type=water/*', filename=true, hive_partitioning=1)
WHERE
    bbox.xmin >= -91.3994
        and bbox.xmax <= -89.3864
        and bbox.ymin >= 29.152
        and bbox.ymax <= 30.5161
DuckDB 1.1.0 is able to interpret the geometry stored as a binary object in the GeoParquet file as a Shapely geometry type.
# dataframe to geodataframe, set crs
gulf_water_gdf = gpd.GeoDataFrame(
    gulf_water,
    geometry=gulf_water['geometry'].apply(wkt.loads),
    crs="EPSG:4326"
)
Let's work with just the water polygons and lines, not the points.
# Apply a lambda to remove point geometries
gulf_water_gdf = gulf_water_gdf[gulf_water_gdf['geometry'].apply(lambda x : x.geom_type!='Point' )]
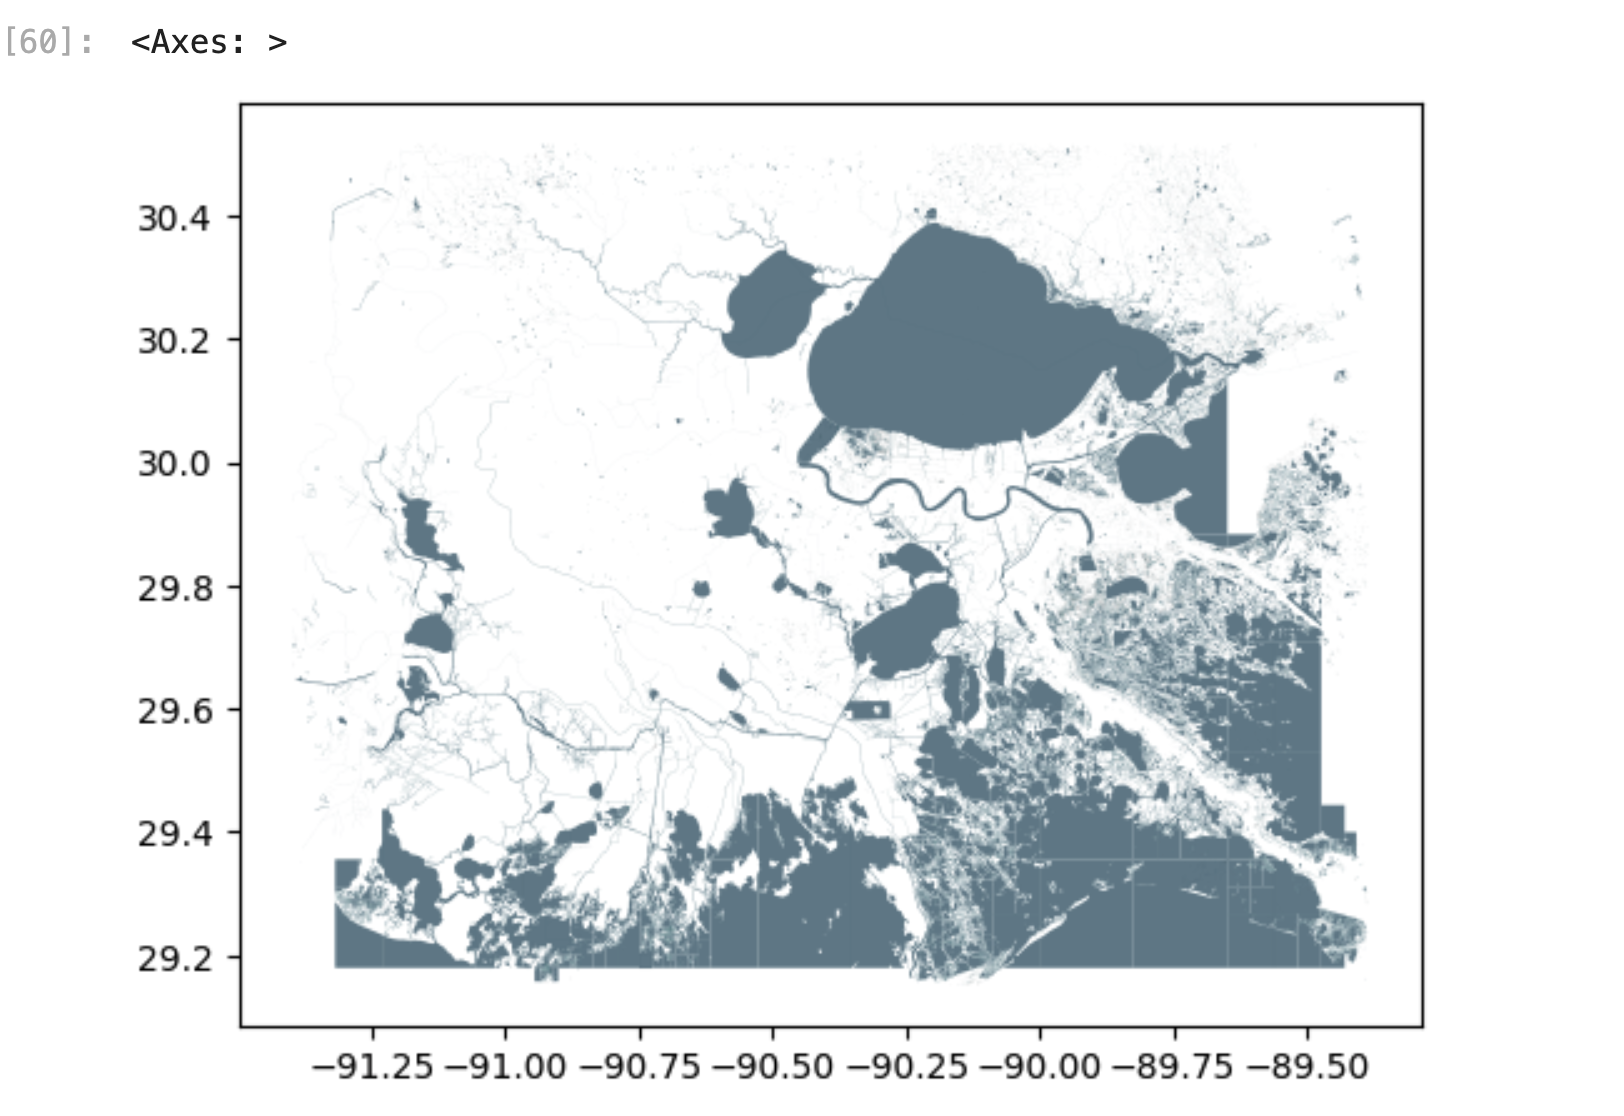
Let's make a quick plot of the data. Voilà!
gulf_water_gdf.plot(facecolor="#628290", edgecolor="#006064", lw=0.05)
Next steps
- Want to speed things up and work with larger extracts of Overture data? Check out our Lonboard tutorial.