Kepler.gl
In this example, we'll query the Overture buildings theme and download data for a specified bounding box. Then we'll load the data into kepler.gl, an open-source tool for working with large map datasets, and visualize the buildings data by data source: OpenStreetMap, Microsoft ML Building Footprints, Esri Community Maps, and Google Open Buildings.
Requirements: Install DuckDB or log into AWS to access Athena. You do not need an account on kepler.gl.
Get only the data you need
Using DuckDB or Athena, query Overture data to get buildings for our area of interest, in this case a bounding box with Hyderabad, India.
- DuckDB
- Athena
LOAD spatial; -- noqa

COPY (
    SELECT
        id,
        level,
        height,
        names.primary AS primary_name,
        sources[1].dataset AS primary_source,
        geometry -- DuckDB v.1.1.0 will autoload this as a `geometry` type
    FROM read_parquet('s3://overturemaps-us-west-2/release/2026-10-21.0/theme=buildings/type=*/*', hive_partitioning=1)
    WHERE
        bbox.xmin > 78.4194
        AND bbox.xmax < 78.5129
        AND bbox.ymin > 17.3427
        AND bbox.ymax < 17.4192
) TO 'buildings_hyderabad.geojson' WITH (FORMAT GDAL, DRIVER 'GeoJSON');
SELECT
    id,
    theme,
    class,
    sources[1].dataset AS primary_source,
    names."primary" AS primary_name,
    ST_GEOMFROMBINARY(geometry) AS geometry
FROM overture.release.v2026_10_21_0
WHERE theme='buildings'
    AND type='building'
    AND  bbox.xmin > 78.383144
    AND bbox.xmax < 78.565011
    AND bbox.ymin > 17.30199
    AND bbox.ymax < 17.423426
Explore the data in Kepler.gl
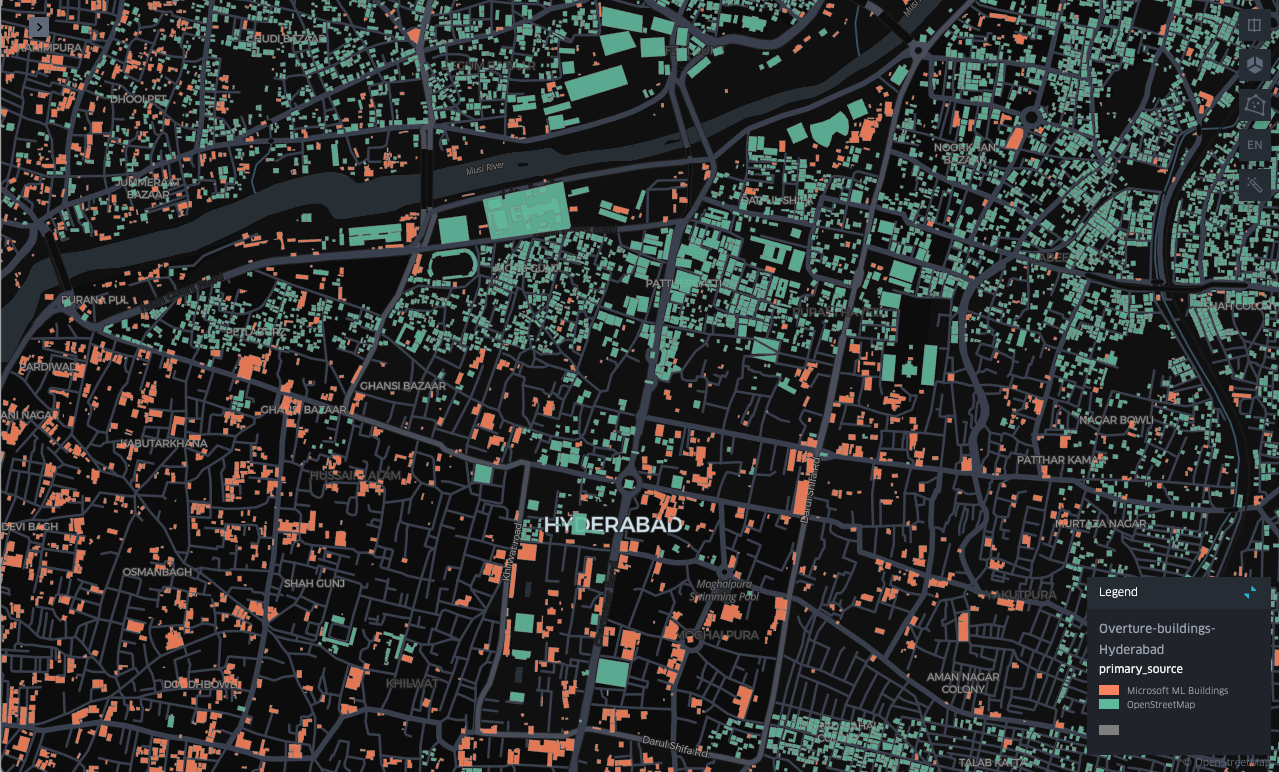
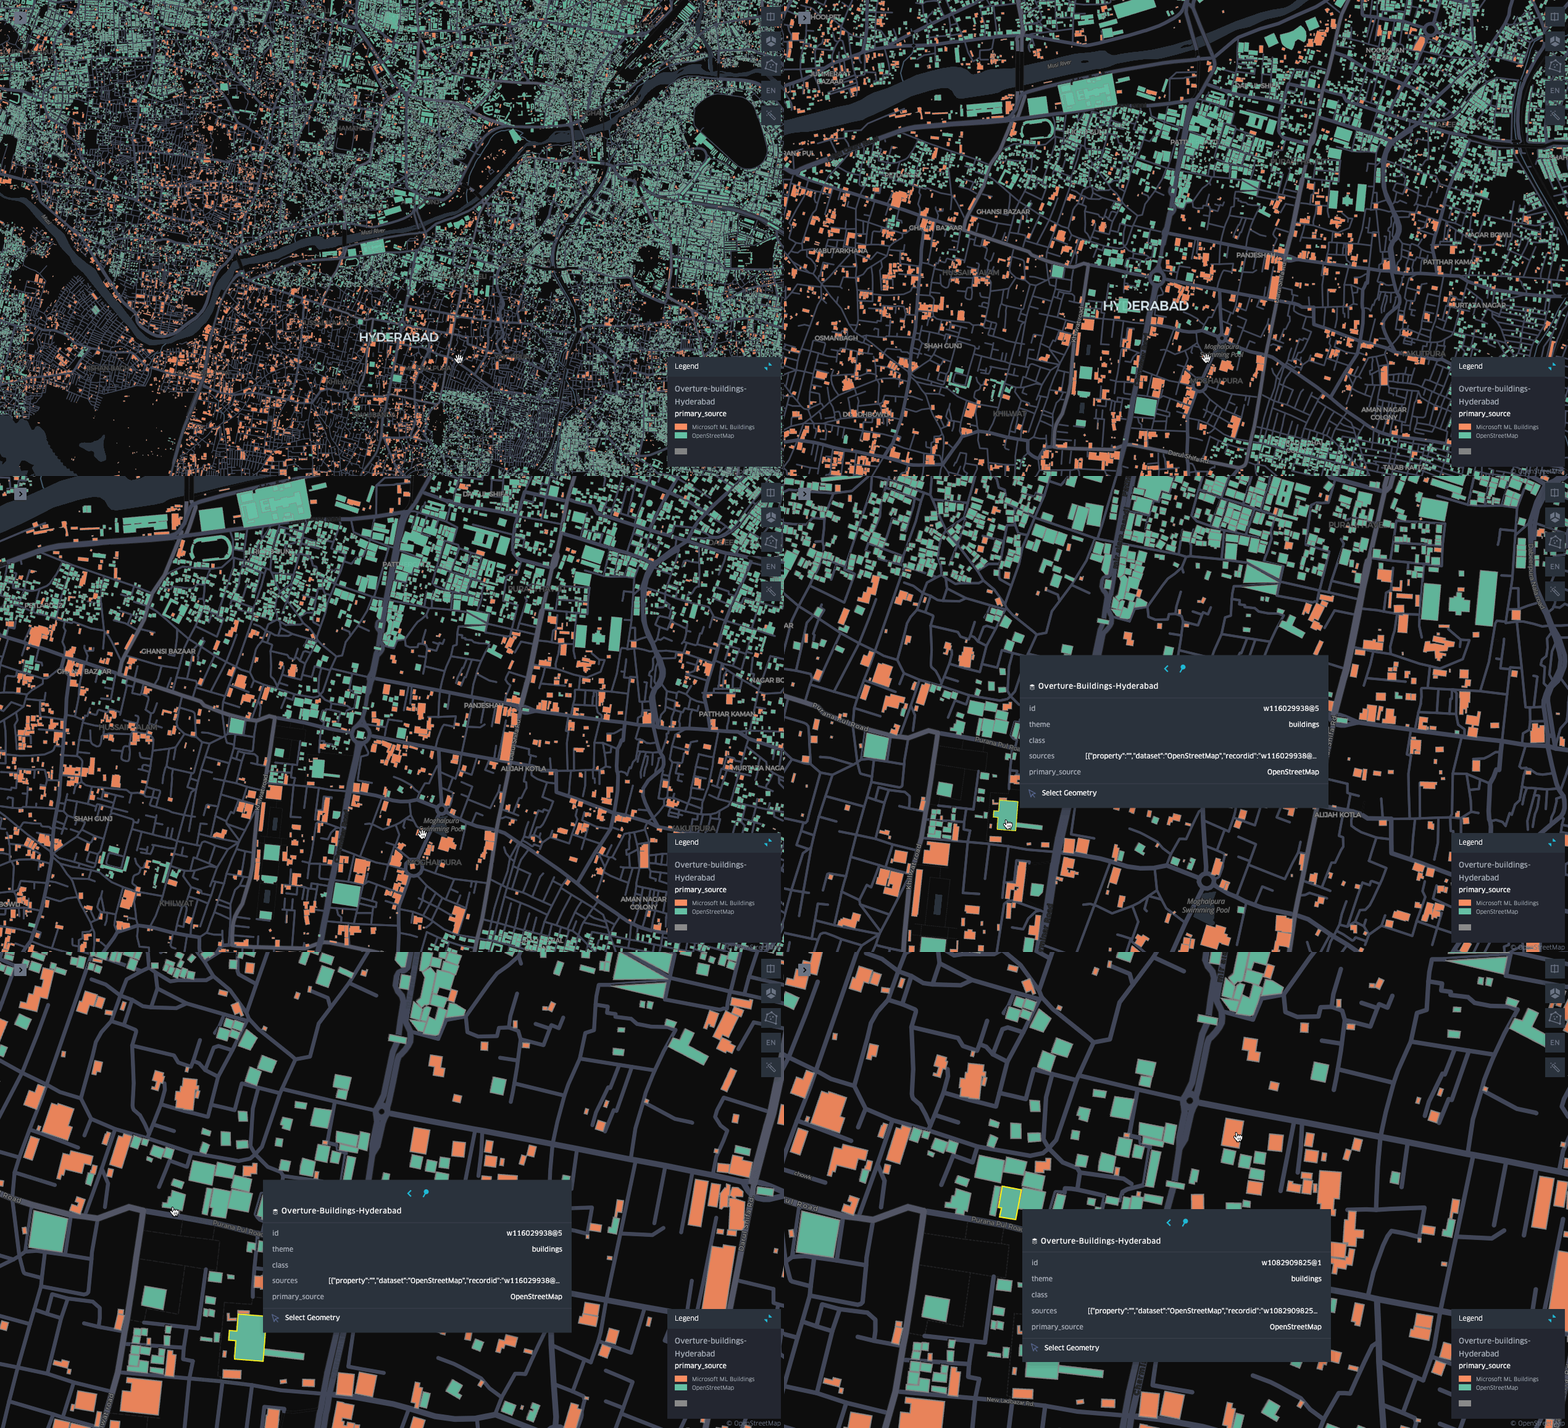
Drag and drop the GeoJSON file into kepler.gl. Style the feature layer by choosing different colors based on the primary_source field. Then you can explore the multiple data sources that Overture has conflated to create the buildings theme.
Next steps
- Make your own interactive Overture map with MapLibre and PMTiles!