CARTO
Access Overture data in CARTO
CARTO provides access to Overture data from different cloud data marketplaces as well as from its own Data Observatory. In order to access Overture data in BigQuery, Snowflake or Databricks, please follow the guides available in the Getting Overture Data section:
- Overture data in Google BigQuery
- Overture data in Snowflake
- Overture data in Databricks
Additionally, CARTO users have direct access to Overture data from the Data Observatory available in the platform. In order to access Overture data from there, you just have to navigate to the Data Observatory section, search for Overture data, and access the tables that you need in a matter of a few clicks.
Analyzing Overture data with CARTO Workflows
Once you have access to Overture data via one of your connections in CARTO, you can start using it with Workflows, a low-code tool for creating and automating data preparation and analysis pipelines. Just drag and drop your Overture data into the canvas and start building powerful geospatial workflows that will then run natively on your connected cloud data warehouse.
In the example below we illustrate a workflow that uses Overture's data to identify buildings in areas with a deficit of cell network antennas. This example leverages data from Overture and other publicly available sources that can be added to the workflow canvas. Then, the workflow uses geospatial techniques such as H3 spatial indexing, the creation of a composite score, and geostatistics techniques such as Getis-Ord Gi* to process the data and identify hot spots and cold spots of telco antenna coverage in different areas of a city.
You can access this step-by-step tutorial available in CARTO Academy in order to re-create this example on your own.
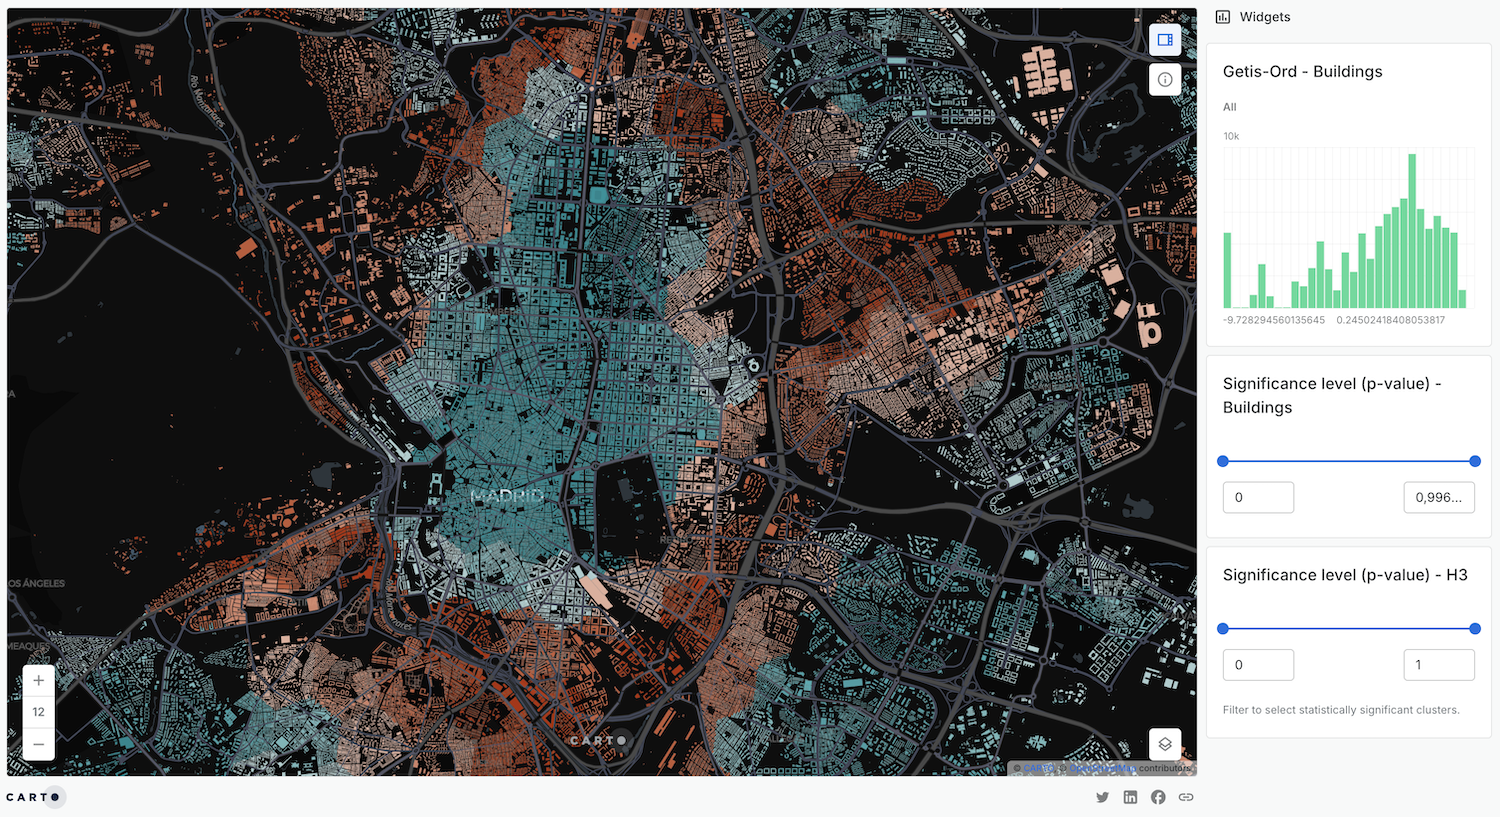
Visualizing Overture data with CARTO Builder
With CARTO Builder users can create interactive dashboards in a matter of seconds. You can access your data instantly and start building interactive maps running natively on top of your data warehouse. Builder provides flexible styling options, access to different basemaps, and the possibility to add widgets and controls for data interactivity. Maps can then be shared with other users in your organization, publicly on the web, or embedded in your applications.
In this example, we are visualizing on a map the results from the workflow described in the previous section; there we can quickly identify that the busy city center of Madrid is well covered by cell towers, enough to satisfy the potential demand. Also, locations with little human activity (like El Pardo park) have also enough network capacity to provide a good service. However, the outskirts of the city seem to be lacking network infrastructure, based on the overall human activity and the cell tower presence patterns in Madrid.
You can also access this map directly from here.
Additional resources
- CARTO's QGIS Plugin allows you to access, visualize, and edit spatial data from the leading cloud data warehouses directly within QGIS. You can also use this plugin to access Overture data in QGIS via CARTO.
- CARTO's Application Development tools provides resources for developers creating top-class spatial apps with their location data. Have a look to our documentation if you'd like to include Overture data in your applications based on deck.gl.